

How Real-Time Dashboards Improve Study Habits
Real-time dashboards help students study smarter, not harder. They provide instant insights into study patterns, progress, and areas that need improvement. Here's why they work:
- Track Progress in Real-Time: Dashboards show grades, time spent studying, and assignment completion instantly.
- Spot Weaknesses Quickly: Identify knowledge gaps and focus on areas where help is needed.
- Optimize Study Time: Use tools like time trackers and productivity heat maps to create efficient schedules.
- Boost Engagement and Results: Schools using dashboards report higher test scores (+23%) and increased engagement (+67%).
Developing Learning Analytics Dashboards to Support Faculty
Understanding Real-Time Study Dashboards
Real-time study dashboards act as centralized tools for monitoring academic performance, turning complex educational data into clear, actionable insights. By integrating with Student Information Systems (SIS), these dashboards provide up-to-date records of learning progress, making it easier for students and educators to track achievements and identify areas for improvement. Let’s break down their key features and how they work.
Main Dashboard Features
Study dashboards come with a range of features designed to simplify the process of tracking academic progress. Here are some of the most common components:
| Feature | Purpose | Benefit |
|---|---|---|
| Progress Meters | Visualizes course completion | Offers a quick overview of progress |
| Performance Analytics | Tracks grades and assessment results | Highlights areas needing improvement |
| Time Management Tools | Monitors study hours and subject focus | Helps create more efficient schedules |
| Early Warning Indicators | Flags risks by analyzing attendance, grades, and behavior | Alerts educators and students to potential issues |
These features work together to provide a clear picture of learning progress, laying the groundwork for deeper data analysis and strategies.
Data Collection and Display Methods
Real-time dashboards gather data from various sources and present it in easy-to-understand formats, enabling quick adjustments to study plans. With natural language processing (NLP), students can ask specific questions, like “How much time did I spend studying last week?” or “What’s my grade trend this semester?”, and get instant answers.
For example, a 9th-grade teaching team might use dashboard metrics to identify students at risk of falling behind, allowing them to step in with timely support. Similarly, math departments have used these dashboards to compare student performance on unit assessments before and after introducing new teaching strategies, helping them refine their methods.
Common visualization tools in these dashboards include:
- Interactive Charts: Dynamic graphs that show grade trends and study time distribution
- Heat Maps: Visuals highlighting peak study hours
- Progress Indicators: Real-time updates on assignment completion and learning milestones
These tools give both students and educators the insights they need to fine-tune study habits and teaching approaches, driving better outcomes.
Improving Study Habits with Dashboard Data
Turn dashboard data into practical strategies to boost your study habits. These insights can guide better decisions on how to approach your studies and manage your time effectively.
Time Management Across Subjects
By monitoring how much time you spend on each subject, you can spot patterns and make adjustments to ensure a balanced schedule. Here’s how dashboard metrics can guide your focus:
| Study Aspect | Dashboard Metric | Action Point |
|---|---|---|
| Time Distribution | Hours per subject | Distribute study time based on the difficulty of each course. |
| Peak Performance | Productivity patterns | Tackle complex topics during your most productive hours. |
| Subject Priority | Assessment scores | Dedicate more time to subjects where you’re struggling. |
Now, let’s dive into how dashboards can pinpoint gaps in your knowledge.
Finding Knowledge Gaps
Dashboards equipped with visualization tools make it easier to identify areas where you might be falling behind. Learning Analytics Dashboards pull together performance data from quizzes, assignments, and other assessments, helping you uncover trends and weaknesses. With this information, you can:
- Monitor your performance across various topics.
- Zero in on specific concepts that need extra attention.
- Track improvements in areas you previously struggled with.
- Adjust your study strategies based on assessment results.
These insights are a game-changer when it comes to fine-tuning your study schedule.
Study Schedule Optimization
Using dashboard data, you can create a study schedule that works smarter, not harder. By pulling data from tools like Learning Management Systems (LMS), student information systems, and online assessments, you get a full picture of your learning habits. Here’s how to make the most of it:
- Identify your peak productivity times and schedule challenging tasks accordingly.
- Use progress indicators to see if your strategies are working.
- Refine your time blocks based on what the performance analytics reveal.
With these tools, you can make your study sessions more effective and tailored to your needs.
sbb-itb-1e479da
QuizCat AI: Enhanced Dashboard Learning
Transform your study habits with AI-powered tools that seamlessly integrate with your dashboard metrics. By leveraging the insights from your dashboard, these tools create a learning experience tailored to your needs. Recent data even suggests these features can significantly improve student engagement and test scores.
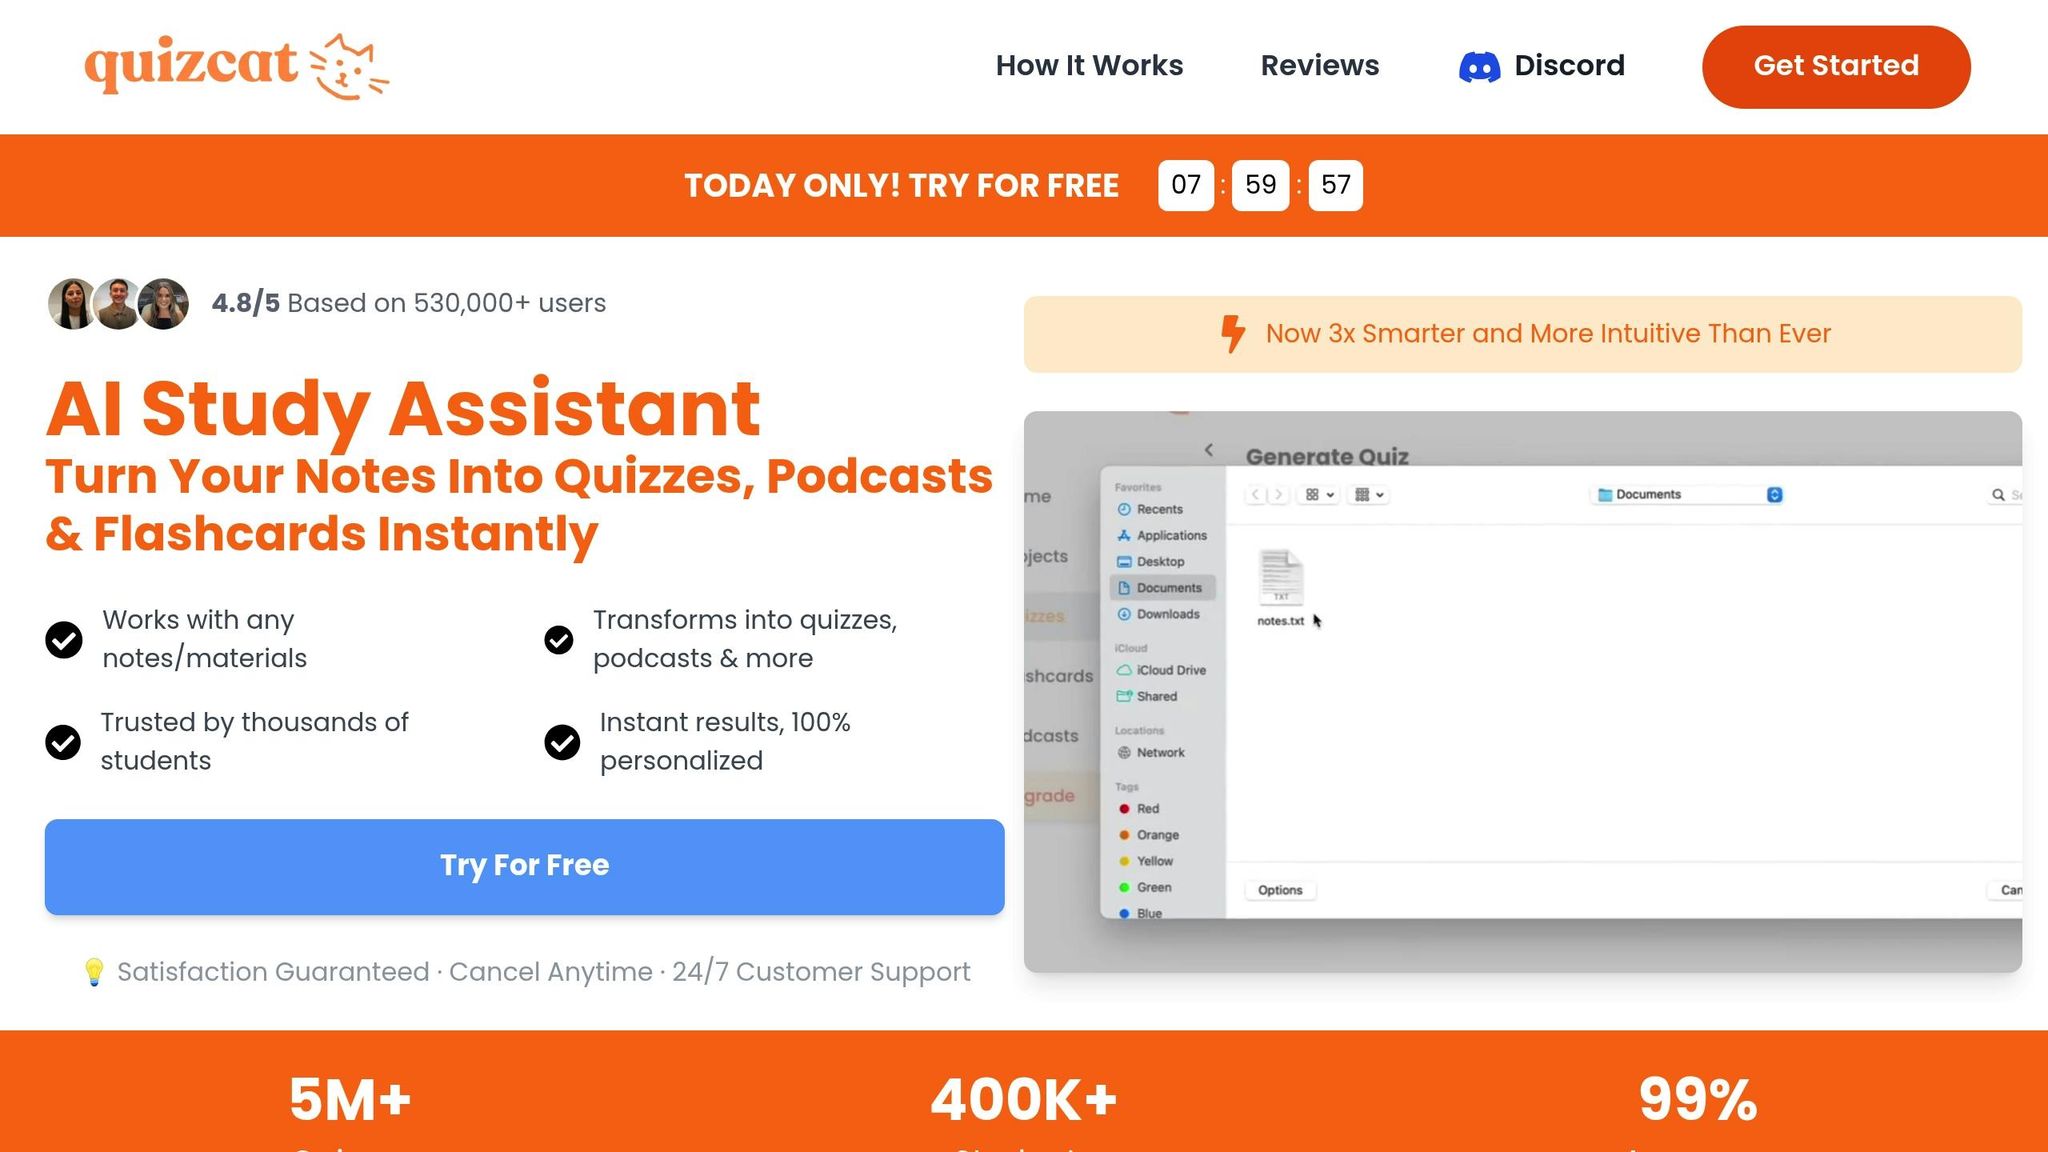
Turning Notes into Study Tools
QuizCat AI takes your notes and transforms them into interactive study materials. Here’s how it works alongside your dashboard:
| Study Material | Converted Output | Dashboard Integration |
|---|---|---|
| Class Notes | Interactive Quizzes | Tracks performance trends |
| Textbook Chapters | Smart Flashcards | Measures knowledge retention |
| Study Guides | Audio Podcasts | Analyzes learning progress |
The system scans your uploaded content and tailors these materials to your dashboard insights, helping you target areas that need attention.
AI-Powered Study Personalization
QuizCat AI uses your dashboard data to create a study experience that feels like it was designed just for you. Here’s what it offers:
- Dynamic Question Adjustments: Tailors difficulty based on your performance trends.
- Targeted Practice Sets: Focuses on your weaker areas.
- Custom Review Materials: Matches your unique learning pace.
- Real-Time Feedback: Syncs directly with your progress metrics.
This personalized approach ensures every study session is as effective as possible, whether you’re at your desk or on the move.
Study Anywhere with QuizCat AI
With QuizCat AI’s mobile features, you can turn downtime into productive study time. The app’s podcast function converts your notes into audio lessons, making it easy to study wherever you are:
- Morning Commutes: Brush up on key concepts while traveling.
- During Workouts: Learn while staying active.
- Between Classes: Quick refreshers throughout the day.
- Evening Wrap-Ups: End your day with audio summaries.
The mobile dashboard tracks your listening habits and comprehension, ensuring your on-the-go efforts contribute to your overall progress. With these tools, QuizCat AI helps you build study routines that stick.
Future Impact of Dashboard-Based Study Habits
Real-time dashboards are reshaping how students track and enhance their academic performance. Recent implementations in U.S. school districts highlight the transformative potential of these tools.
Creating Lasting Study Routines
In Norwalk Public Schools, dashboards have revolutionized how students approach their studies. By moving to data-informed learning, the district has seen notable progress.
"While there was an expectation that schools were analyzing data and teachers were adjusting instruction based on that data, it was very cumbersome – nothing was standardized. We realized that as we were asking schools to do this work, we hadn't provided a tool for them to be able to more effectively engage in the work."
– Kristen Schmitz, Director of School Improvement for Norwalk Public Schools
The shift to dashboard-driven study habits has brought clear benefits:
| Aspect | Before Dashboards | With Dashboards |
|---|---|---|
| Progress Tracking | Manual and fragmented | Real-time and comprehensive |
| Performance Analysis | Feedback delayed | Immediate insights |
| Study Planning | Generic and broad | Personalized and data-driven |
| Time Management | Inconsistent and unstructured | Optimized and well-organized |
These structured routines help students build a foundation for long-term academic achievement.
Meeting Academic Goals with Data
Butler School District 53 offers another compelling example of how dashboards can drive academic success.
"One of the things we really do well is set performance goals for each and every one of our students, and also create personalized learning plans. We use our common assessments in the classroom to triangulate the data so that we can really centralize a dashboard to view all data points and then identify common themes for students who are struggling according to our MTSS model."
– Paul O'Malley, Superintendent for Butler School District 53
Dashboards have led to several key improvements:
- Pinpointing Struggles: Teachers and students can quickly identify and address areas that need attention.
- Connecting the Dots: Students see how factors like attendance and engagement influence their academic progress.
- Holistic Insights: Modern dashboards combine academic performance data with social-emotional and behavioral metrics.
Conclusion: Maximizing Study Success with Dashboards
Real-time dashboards offer a powerful way to combine data insights with personal awareness, turning traditional study routines into dynamic, tailored learning experiences with tools like QuizCat AI.
Research highlights that dashboard-based learning can significantly enhance both engagement and test outcomes. This is largely due to its ability to address multiple aspects of learning in a structured way:
| Learning Aspect | Dashboard Impact | Student Benefit |
|---|---|---|
| Academic Progress | Tracks performance in real-time | Enables quick adjustments to plans |
| Time Management | Monitors daily study habits | Helps create efficient schedules |
| Emotional Awareness | Tracks mood and focus patterns | Improves stress management |
| Knowledge Retention | Analyzes comprehension levels | Focuses on targeted reviews |
By helping students recognize and manage their emotional states during study sessions, dashboards not only improve academic performance but also encourage a healthier, more balanced approach to learning. This means students can identify their most productive times and create sustainable study habits.
The future of dashboard technology is even more promising. With artificial intelligence and predictive analytics, these tools are evolving to identify potential learning challenges before they arise. This progress builds on the benefits already proven, paving the way for even greater academic success.
If you're ready to experience the advantages of dashboard-based learning, QuizCat AI offers an introductory week for just $0.99. Start small by focusing on one area for improvement while regularly reviewing your dashboard insights. Consistent engagement and fine-tuning will set the stage for long-term success.
FAQs
How do real-time dashboards work with Student Information Systems to track learning progress?
Real-time dashboards link directly to Student Information Systems (SIS) through application programming interfaces (APIs). These APIs ensure seamless data sharing, allowing dashboards to pull the latest details like grades, attendance records, and engagement stats straight from the SIS.
With this constant stream of updated information, students can track their academic performance, spot areas where they might be struggling, and make adjustments to their study routines. These dashboards offer a clear and up-to-date snapshot, helping students stay organized, focus on their goals, and work toward improving their results.
How do real-time dashboards help students improve their study habits and boost test scores?
Real-time dashboards are a game-changer for students aiming to sharpen their study habits. With instant feedback, visual tools to track performance, and customizable alerts highlighting areas that need attention, these dashboards make it simple to pinpoint strengths and weaknesses. This clarity empowers students to tweak their study plans and concentrate on what truly matters.
By delivering clear and actionable insights, dashboards keep students actively engaged and encourage a hands-on approach to learning. The result? Better preparation, a stronger grasp of essential concepts, and higher test scores.
How can students use real-time dashboards to create better study plans and address weak areas?
Students can use real-time dashboards to fine-tune their study plans by analyzing performance data such as quiz scores, completion rates, and overall progress. This kind of feedback helps them identify areas where they struggle and prioritize topics that require extra focus.
These dashboards often include visual tools like graphs and progress bars, making it easier to track achievements and stay motivated. By zeroing in on specific challenges and adjusting their schedules, students can make their study time more productive, boosting their chances of academic success.